Engineering dashboard
The metric the dashboard refuses to show
An engineering-management dashboard whose defining constraint was a policy: individual metrics are self-service only, never leadership-visible, enforced in the data layer rather than the UI.
- Python·React·Vite·Cloudflare Pages·Jira API


Three rituals, five minutes each
The audience is under ten people, and they open the same views on the same cadence. Monday, the capacity question: who is working on what, and is anyone overloaded or idle? Sprint boundaries, the commitment question: what did each team sign up for, and what slipped? And on a rolling basis, the efficiency question: are we shipping on time, and where is time going?
Each session is five to fifteen minutes on a laptop in office light. Not a wallboard, not a phone. That framing sets the bar for every design decision: the dashboard should read like a briefing a competent chief of staff prepared, not like a BI tool surfacing everything it knows. The landing view is literally that: a one-sentence organizational lede in large type, then per-product headline rows sorted worst-first, so the eye finds trouble in the first two seconds.
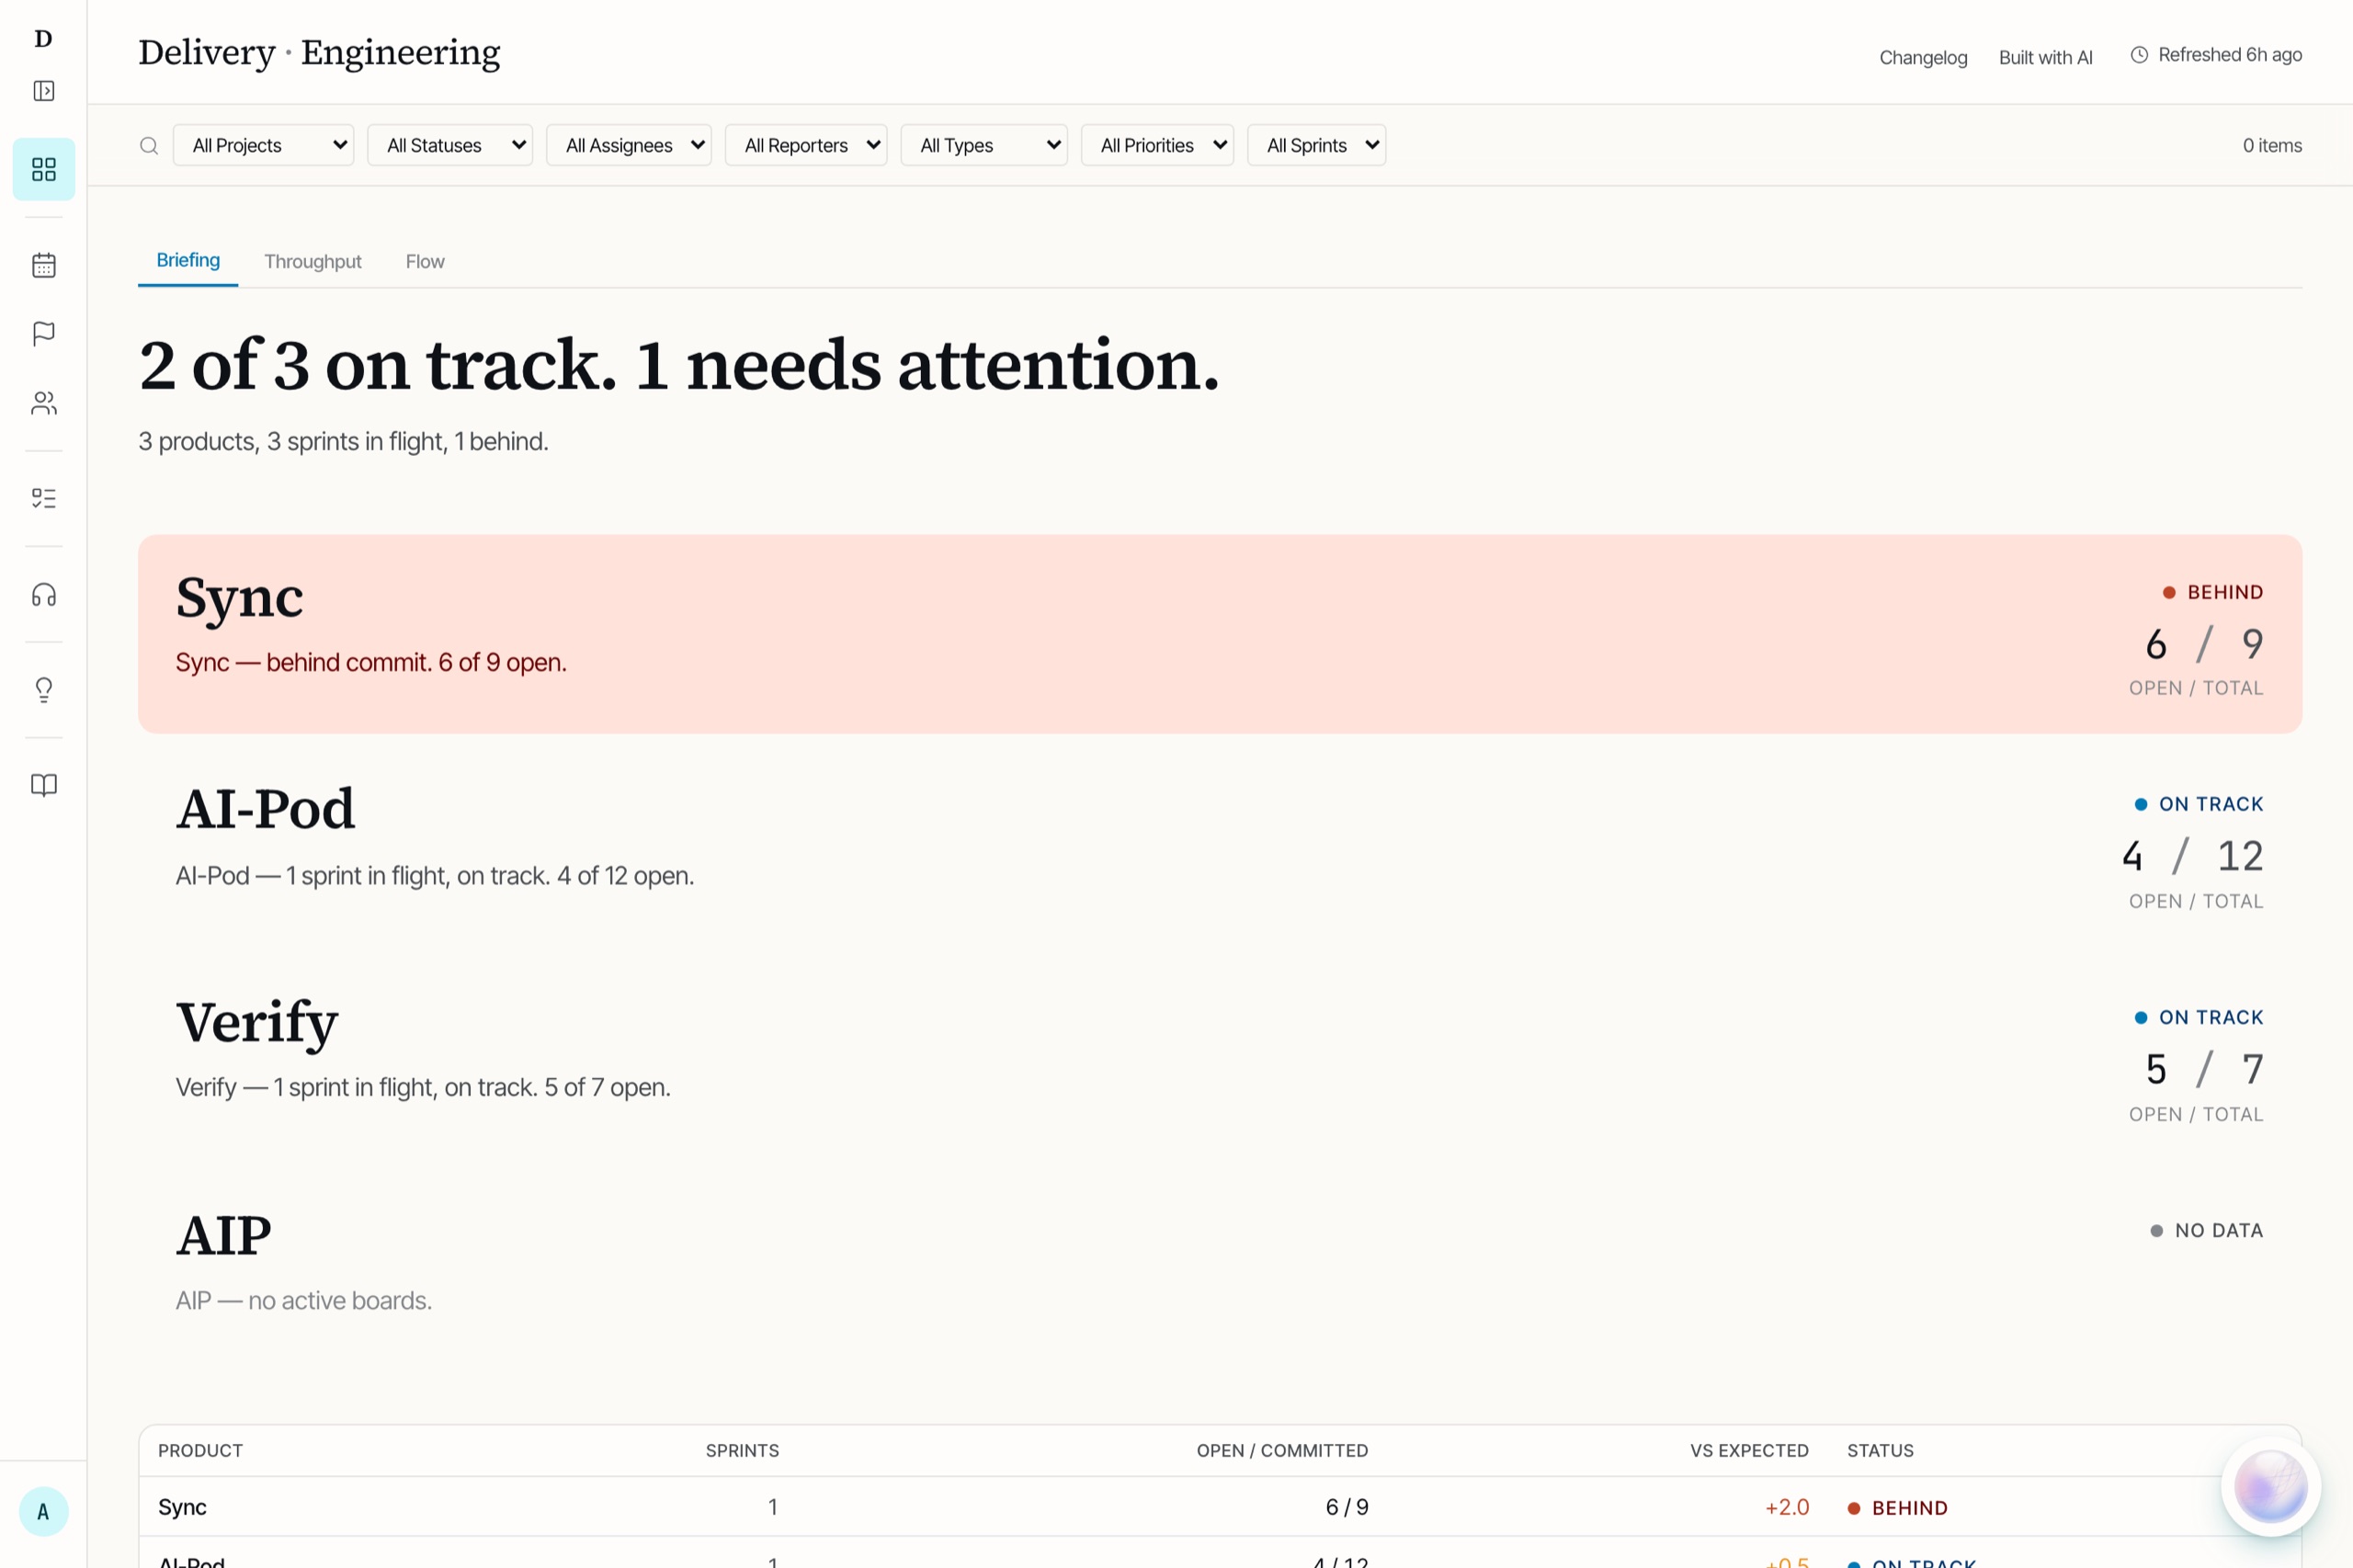
Figure 1. The landing view. The lede is a sentence, not a KPI grid, and the product that needs attention is the one with a ground under it — worst-first, so the first two seconds are spent on the only row that has a decision in it.
The dashboard running locally against a synthetic payload: fictional roster, renamed products, a Jira host on a reserved domain. Every number, sprint and status is the shipped ETL's own shape.
- 6
- products, 8 boards, one Jira source
- 46
- engineers in the roster
- 2×
- daily refresh — matched to when leadership actually looks
- 393
- tests across the frontend and the ETL
M-17, the policy with an ID
The interesting constraint arrived before the interesting feature. During the architecture review that scoped this build, every recommendation got a tracking ID, and row 17 of the metrics table was the only critical-flagged item in the people section: individual stats are self-service only, never leadership-visible.
The reasoning is Goodhart's law, written into a policy document with an owner and a review cadence: the moment a measure of throughput becomes a target, it stops measuring throughput and starts measuring the behaviour that games the measure: ticket-splitting, risk avoidance, mis-reporting. The document's sharpest clause is its exceptions section, which reads, in full: there are none for standing dashboard views.
What makes M-17 worth a page is where it's enforced. Not in the UI. The product statement is one line: M-17 is not a rule to remember, it's a constraint baked into the data layer.
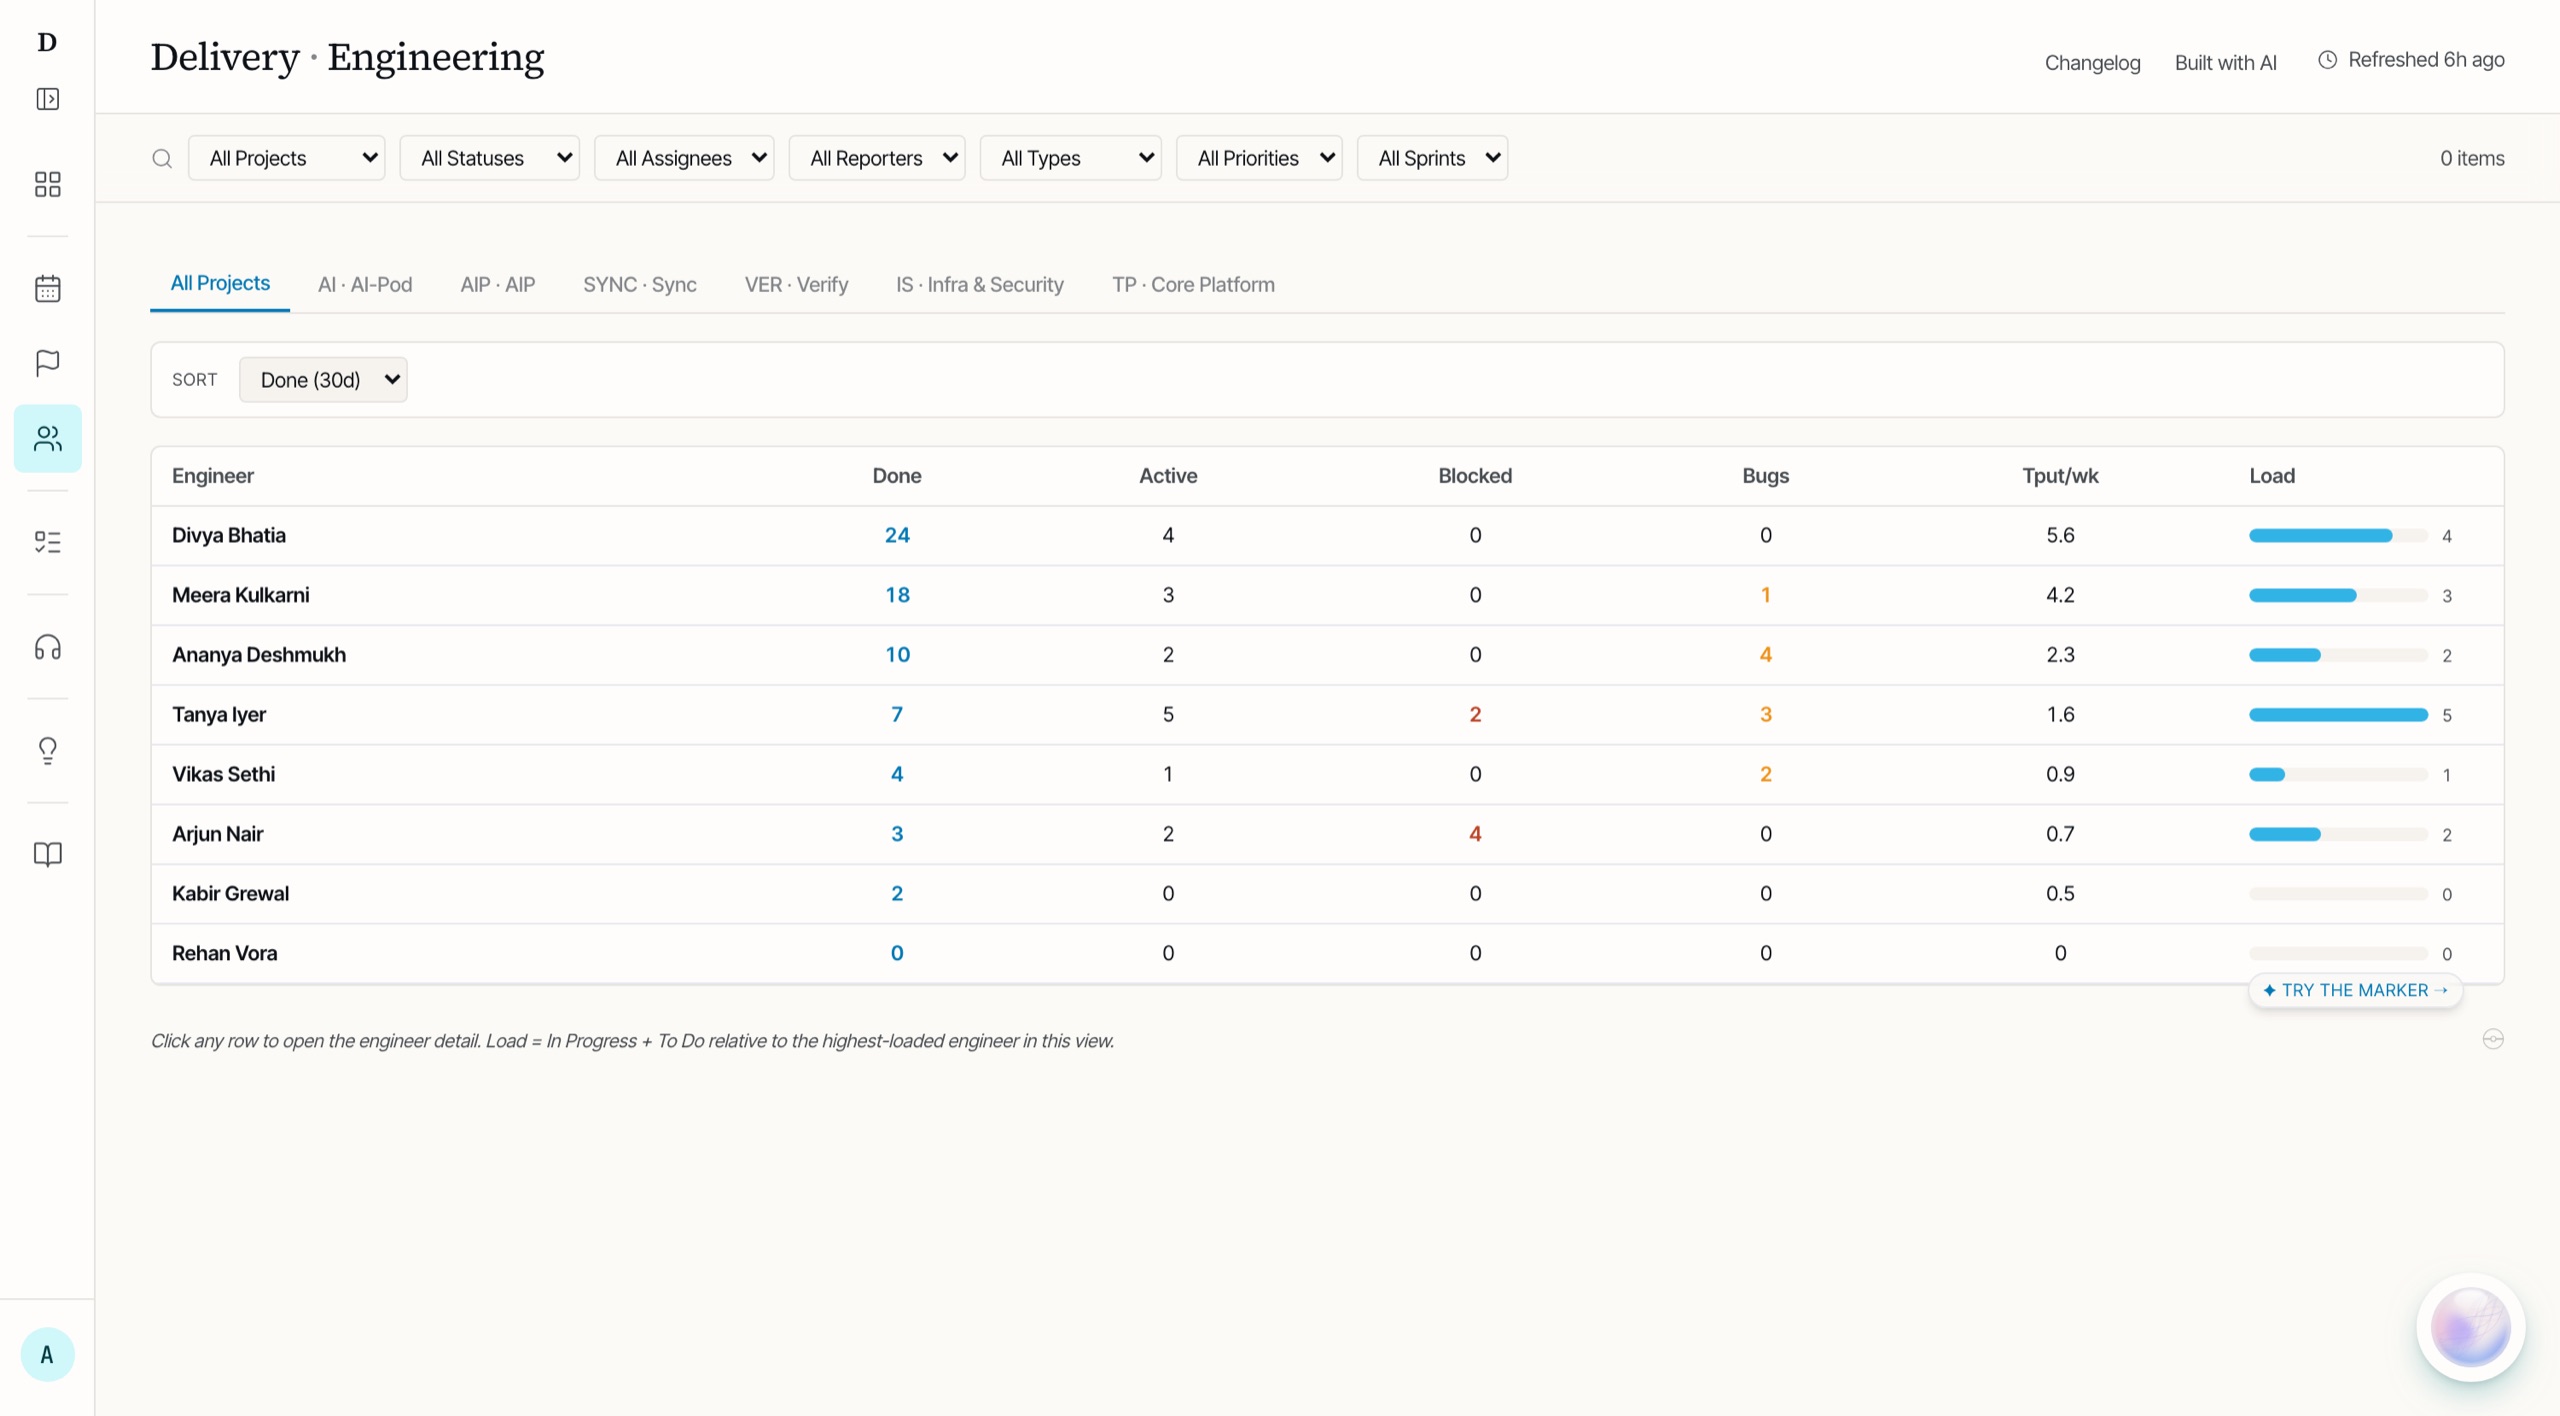
Figure 2. The per-engineer view, signed in as an operator with the highest role the product has. Count what's here: done, active, blocked, bugs, throughput, load. Now look for cycle time or lead time. There is no column, because there is no field, because the function that would have computed it returns a breakdown by issue type and stops.
The dashboard running locally against a synthetic payload. Names are fictional; the columns, the sort and the load denominator are the shipped ones.
Team aggregates — cycle and lead time
- 3.1d
- cycle p50
- 9.4d
- cycle p90
- 5.7d
- lead p50
- 46
- engineers, n
Both viewers get these. Aggregates answer the efficiency question without naming anyone.
Per-engineer rows
| Engineer | Done 30d | Blocked | Bugs | Tput/wk | Cycle time |
|---|---|---|---|---|---|
| R. Iyer | 14 | 0 | 1 | 4.1 | ∅ |
| S. Bhat | 11 | 2 | 3 | 3.2 | ∅ |
| You | 9 | 1 | 0 | 2.8 | ∅ |
| M. Rao | 7 | 0 | 2 | 2.4 | ∅ |
| T. Sen | 5 | 3 | 4 | 1.6 | ∅ |
Leadership sees everyone's counts and load — the capacity question is policy-allowed. The last column is empty for them too: per-engineer cycle time is never computed, so there is nothing to show and nothing to demand.
Figure 3. The same payload through two viewers. Flip it — and notice the one column that's empty for both.
Synthetic names and numbers; the field structure and the whitelist behaviour are the shipped ones.
The enforcement is five layers deep, and the order matters:
The ETL never computes it
The cycle-time function returns a breakdown by issue type and nothing by engineer. This is the load-bearing layer: a number that is never computed cannot be leaked, requested, subpoenaed by a quarterly review, or added back by a well-meaning intern in the UI. Every other layer is defence for this one.
The payload model has no field for it
The validation schema for the published payload simply lacks a byEngineer field on cycle and lead time. A producer change that tried to add one would fail validation before anything shipped — the policy is a type, not a convention.
A test that exists to fail
A defensive test asserts the output dictionary does not contain the forbidden key. It adds nothing today; it exists so that a future regression that breaches the policy turns red in CI with the policy's ID in the test name, which makes the violation a conversation instead of an accident.
Whitelist, default-deny
When an engineer loads the dashboard, the edge worker projects the payload through an explicit whitelist: their own rows, team aggregates, and a cosmetic view of teammates. Fields not on the list never leave the server — so a new leadership field added next quarter can't silently reach the wrong audience.
The layer that only explains
The interface's whole job under M-17 is a tooltip: aggregate stats only, per the data-handling policy. UI-level hiding was rejected as the enforcement mechanism from the start, for the obvious reason the scope doc states plainly — UI hiding alone is not security.
Figure 4. Where M-17 lives. Each layer catches what the one above it can't.
Did it hold?
Yes, and the evidence is better than an assertion, because the policy got tested by the product's own roadmap three times.
The hardest test was a feature category built specifically around individuals: a later phase added per-engineer profile cards with levels, badges, and even a seasonal ladder. That's a leaderboard-shaped object landing on top of an anti-leaderboard policy. The build's defence was to make the cosmetic layer structurally incapable of doubling as a review artifact: card rarities and matchups computed from nothing but the aggregates everyone already sees, ladder ranks named absurdly on purpose (the code comment says deliberately silly so the ladder can never be mistaken for a review artifact), and a legend closing with the policy citation. Second, the free-form AI query surface was named in its own design doc as the one place M-17 could be undermined, and answered by construction: the context handed to the model contains no per-engineer timing metrics, so no phrasing of a question can extract them. Third, the design review that scored the whole product a C+ put the M-17 structure on its short list of things any overhaul must preserve — calling it the strongest brand signal in the product, despite no design effort having gone into expressing it.
The honest asymmetry: the protection half of M-17 held everywhere, but the self-service half is thinner than the policy promises. The policy specifies three roles with reporting-chain awareness; the code ships two, gated by an email allowlist, and the access wall currently admits only admins. The engineer-facing view is written but not yet reachable by engineers — so today the policy in practice reads "nobody sees individual timing metrics," which is defensible, rather than "individuals see their own," which is the design. That gap is an access-policy change away, and it belongs on this page rather than under it.
Everything else is pipeline
The rest of the system is deliberately boring, in the way that makes a two-person maintenance surface possible. One data source, Jira, at nine parallel queries per refresh. Pure-function metrics modules in Python, unit-tested, no framework. History lives as daily JSON snapshots committed to an orphan git branch: free, versioned, auditable, and enough to carry every trend metric without a database. The frontend is a static build on Cloudflare Pages behind Cloudflare Access, with a small edge worker doing the payload projection.
Figure 5. The whole system, and where M-17 sits in it. Follow the payload left to right: the metrics module never computes a per-engineer timing, the schema has no field to carry one, and the worker projects through a whitelist before anything reaches a browser. Three of the five enforcement layers are places on this line — which is the argument for drawing it at all.
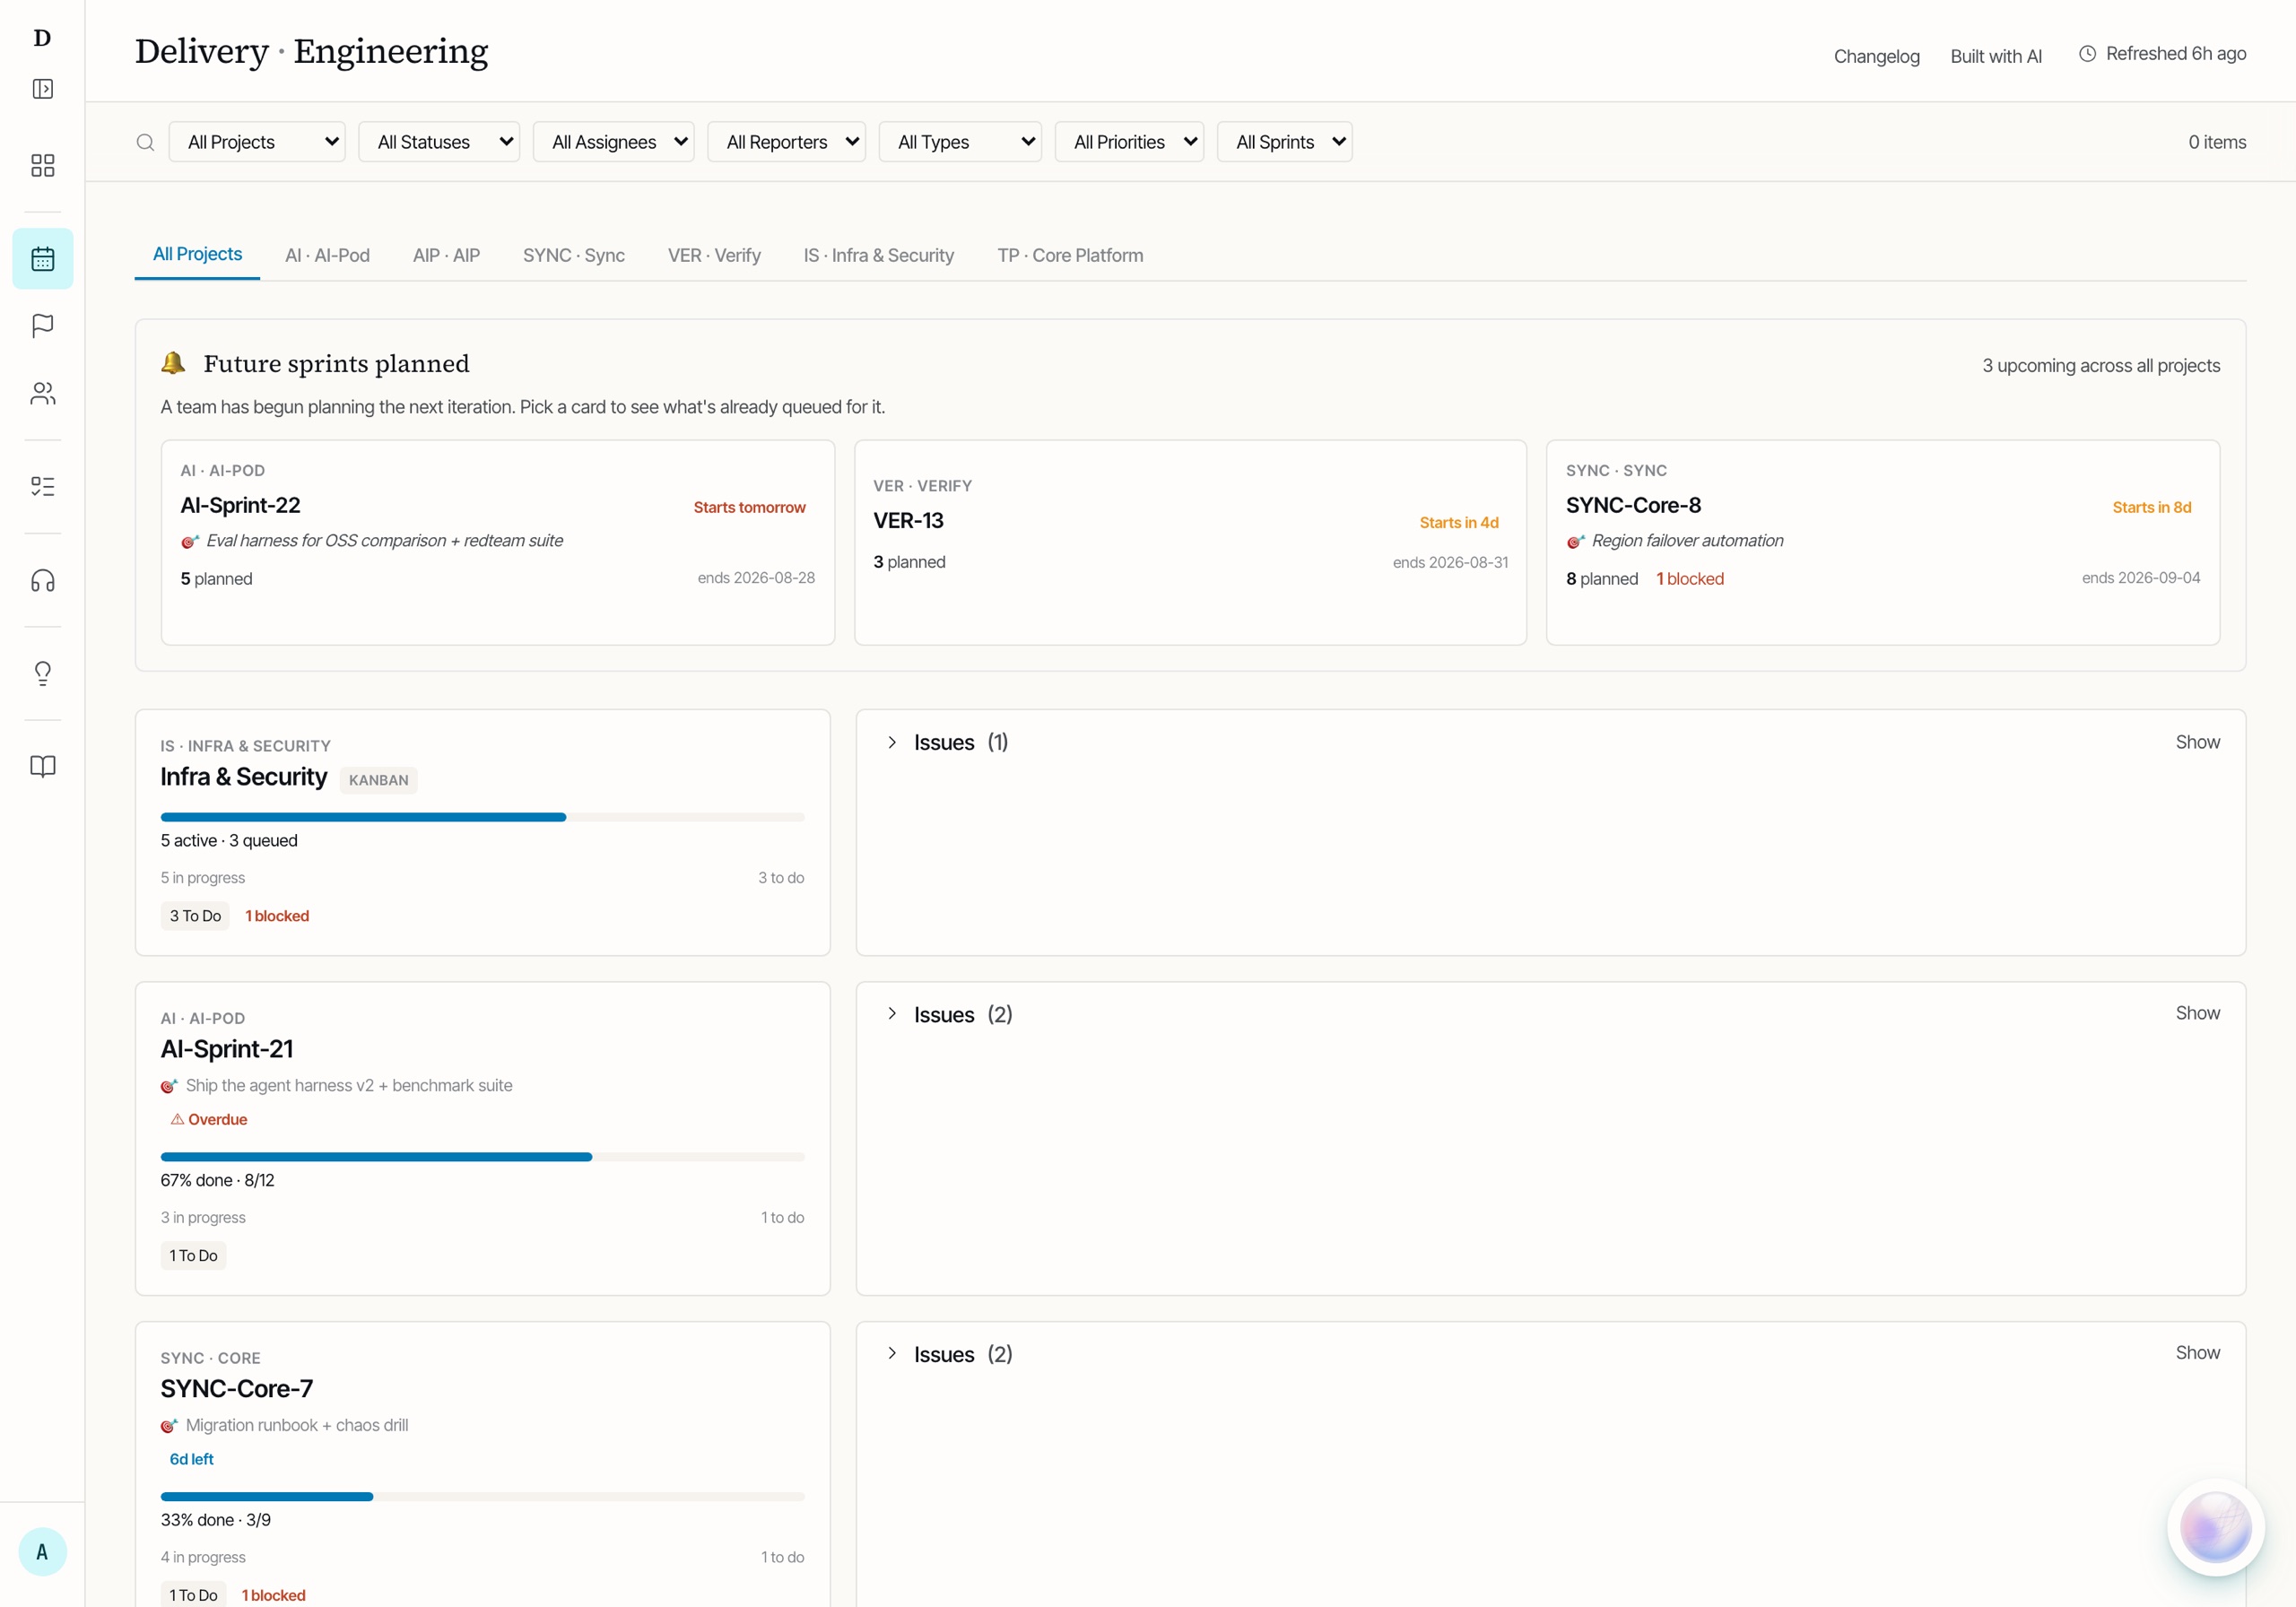
Figure 6. The sprint view, which is also the honest evidence for this page's own criticism: per-team cards answer 'is this sprint on track' well and 'who across all six products is overloaded on a Monday' not at all. The capacity ritual is served by scrolling, which is not being served.
The dashboard running locally against a synthetic payload. Sprint names, goals and counts are the seed's; the board types, overdue flag and future-sprint strip are the shipped view.
Even the refresh cadence is an argument rather than a default. Twice a day, timed to when leadership actually looks: the early-morning run was dropped after observing nobody loads the dashboard before eleven. A pipeline that runs hourly for an audience that looks twice daily isn't rigour; it's rate-limit spend.
What I'd do differently
Ship the self-service half with the policy, not after it. M-17's legitimacy with engineers rests on the trade: leadership doesn't see your numbers, and you do. Shipping the protection first and the self-service view second — where it still waits — means the policy currently asks for trust it was designed to earn structurally.
The capacity ritual got the weakest view. The Monday question is cross-cutting (who, across all six products, is over- or under-loaded) and the shipped answer is a sortable table plus per-team sprint cards, neither of which answers it in one look. The review said it plainly: the policy correctly blocks per-engineer timing, but the capacity question is policy-allowed and unserved. Load, notably, has no real denominator: there's no PTO calendar, so "loaded" means "relative to the busiest visible person," which is honest only if you know it.
Write the policy's revision trigger into the features that stress it. The data-handling policy requires review when a new metric is added. The gamified layer added a composite per-engineer health score — arguably exactly that — and the policy's last-reviewed date predates it. The score is built only from already-visible aggregates, so I believe it complies; the point of a review clause is that compliance shouldn't rest on the author's belief.